Voice of Customer at WooliesX: from survey scores to causes
Turning Woolworths Online's weekly customer survey into analysis product teams could act on: automating the data pipeline, finding what actually drove satisfaction, and linking software changes to customer outcomes.
The question
Woolworths Online sent a Voice of Customer (VOC) survey to customers every week, asking about their most recent shop. It was one of the key measures of how the online business was performing. Scores were reported every week, but a score only says that something changed. The product teams needed to know why, and what they could do about it.
Context
I was a contract UX researcher in the UX Research and Insights team at WooliesX, the digital arm of Woolworths, from November 2017 to May 2018. Our audience was the product squads building the Woolworths Online website and app, who worked in short development cycles and needed findings they could act on.
The survey collected over 70 items of data from each respondent, including scores on a seven-point scale and open comments. Around a quarter of the customers offered the survey completed it.
What I did
Automated the data pipeline. The weekly survey export arrived as a spreadsheet that needed cleaning by hand before it could be analysed. I wrote a script that turned it into a clean dataset: tidying each field, recoding responses, and combining the 16 separate free-text comment fields into one, so every customer’s comments could be read in one place. The script also checked the column headings first, and stopped if the export format had changed, so a silent change upstream could not corrupt the analysis.
Went beyond the headline score. I analysed the data statistically using open-source software. Cross-tabulations with chi-square tests showed whether satisfaction differed by state, customer life stage, affluence segment, basket size, business or personal purchase, and pick-up or home delivery. Multiple regression showed which parts of the experience drove overall satisfaction, run separately for delivery and pick-up customers, for each segment and life stage, and for each basket size, because what matters to a retiree collecting a small order is not what matters to a young family having a large one delivered.
Linked releases to results. VOC scores were reported by the date a customer completed the survey. But customers responded up to two weeks after their order, so a single day’s score mixed together orders from across a fortnight, blurring the effect of any release or outage. I re-indexed the scores by the date the order was placed, and lined them up against software releases and incidents. That made it possible to ask whether a change had actually helped or hurt, and it gave developers something they rarely see: a direct line between the work they shipped and how customers experienced it.
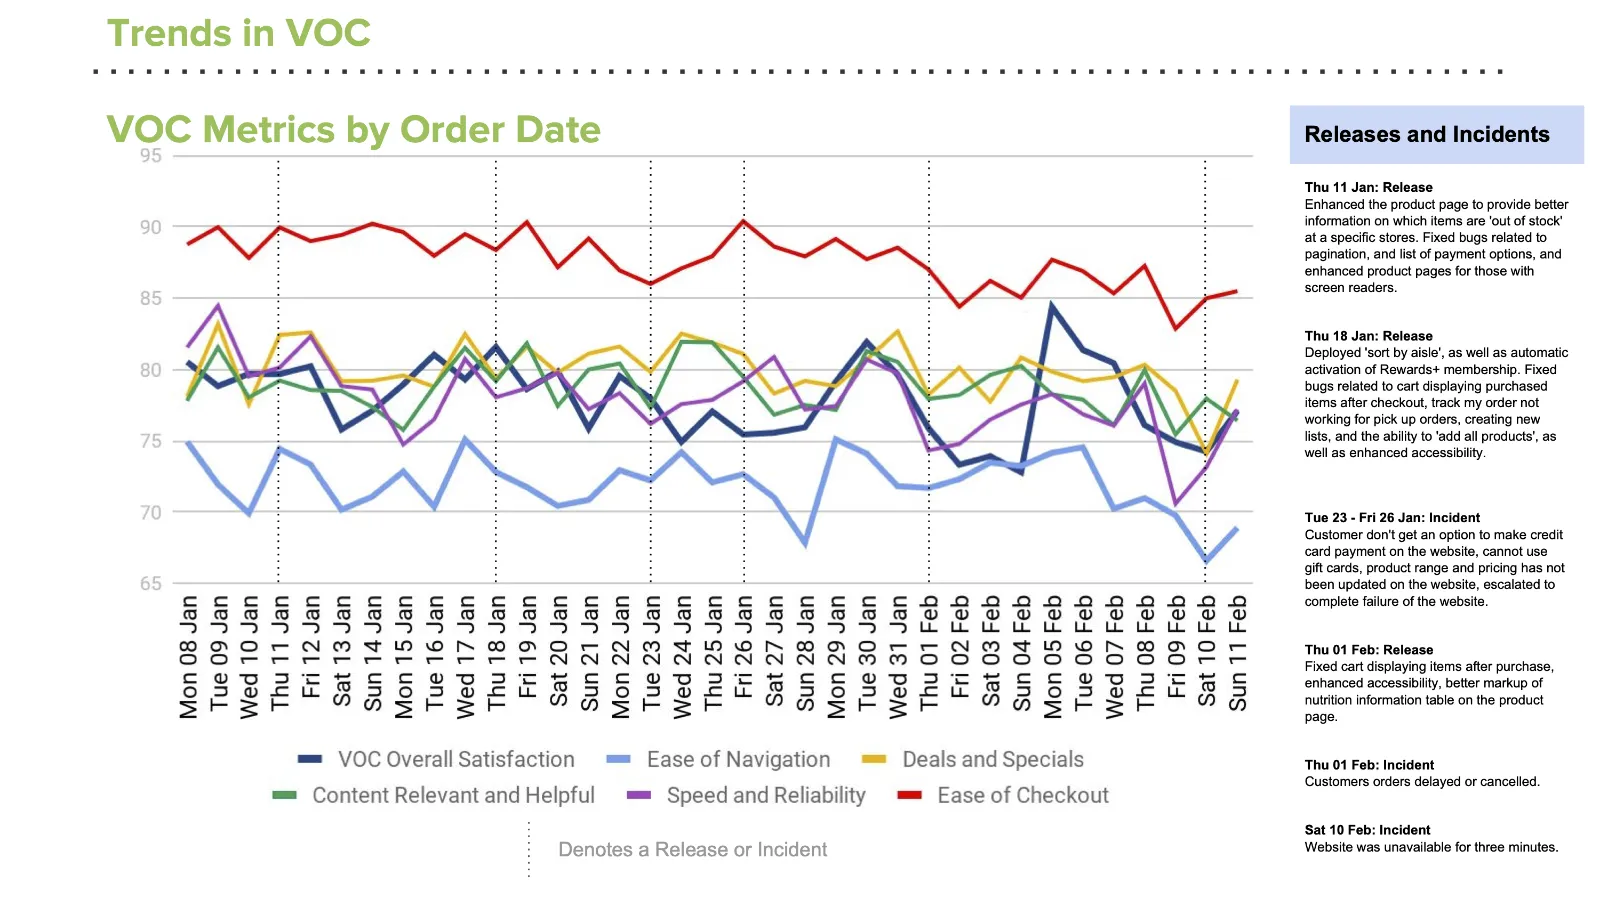
VOC metrics plotted day by day, with software releases and incidents marked, so a squad could see what its changes did.
Worked with the squads, not just for them. Rather than waiting for requests, I met with product owners to understand what their teams were working on, then presented analysis tailored to each development team. I wrote the PULSE: VOC Online reports, each focused on one issue or one squad’s area, combining the numbers with customers’ own words grouped into themes. The verbatim mattered as much as the numbers: reading customers describe a problem in their own words built an understanding of it, and a motivation to solve it, that a score alone could not. For squads new to the data, I also explained how the survey worked, what it could and could not tell them, and how research findings could help them decide what to prioritise.
What we found
The Stock Theory. In early 2018, every key satisfaction measure began trending down, with no clear link to releases or incidents. Regression showed that two stock-related measures, the completeness and accuracy of the order and the range of products available online, together explained 43% of the variation in overall satisfaction. I set out a theory of three distinct stock failures: items shown as not available at the customer’s store, items out of stock when the order was placed, and items out of stock by the time the order was packed. Each affected different parts of the experience. Customers kept finding items listed as unavailable on the shelves of the very store that packed their order.
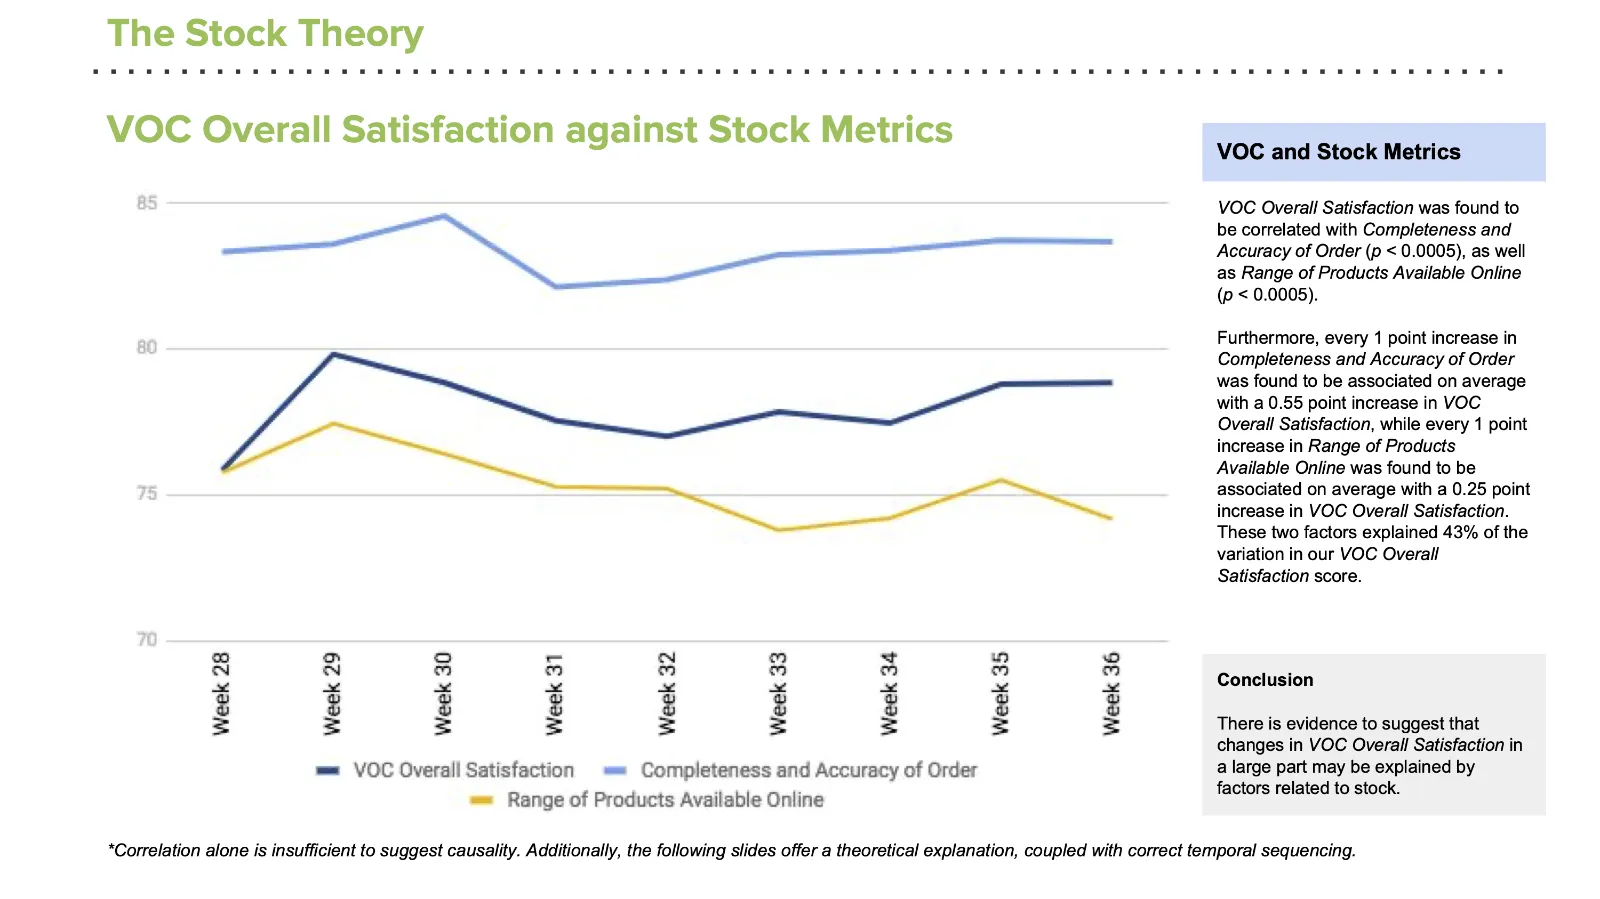
Overall satisfaction tracked against stock measures, with the caveat that correlation alone does not show cause.
I treated the theory as a best explanation, not a proven one, and revised it as evidence came in. A first addendum noted that recent releases had made stock problems more visible to customers, so some of the decline might reflect awareness rather than more stock problems. A second, after talking to several teams, concluded that no single fault was responsible: a cluster of releases, database changes, and bugs together explained the decline.
Amending orders. Customers did not realise they could change an order after placing it, or found it too hard, and many said Coles let them. Customer service call records confirmed the cost: thousands of calls about amending orders in a single quarter.
Plastic bags. Customers mentioned plastic bags more than 860 times in 12 weeks of feedback, and those who did gave overall satisfaction scores about 14% lower than average. Many asked for fewer bags, returnable bags, or boxes.
Who online shopping is for. The comments also showed how much the service mattered to particular groups: people with disability, older people, carers, parents of young children, and people recovering from illness. For many of them, online shopping was not a convenience but what made independent living possible.
I’m blind, so have great difficulty doing my grocery shopping by myself. Now I can buy what I want, when I want and without being judged and told no by others. Woolworths online shopping gives me independence.
Not every comment was that serious. I also kept a collection of the funnier ones, such as “there is no such thing as a substitute for an Iced Vovo.”
Knowing the limits of the data
Part of the job was making sure teams did not over-read the numbers.
- Self-selection. Customers who chose to answer the survey might differ from customers overall.
- Only completed orders. The survey only heard from people who finished their shop. People who abandoned their cart were invisible, even though cutting cart abandonment by just five percentage points would have been worth hundreds of millions of dollars a year in sales.
- Feedback reflects what customers already know. Customers could say what went wrong, but not easily imagine features that did not yet exist.
- Correlation is not cause. Every analysis carried that caveat, alongside a theory of why and evidence that the timing fitted.
What changed
Both of the specific issues were later acted on, although many factors would have fed into those decisions. When Woolworths removed single-use plastic bags in June 2018, online shoppers could choose reusable bags for $1 an order or crate-to-bench delivery for $3.50. And the Woolworths app now has a Change My Order feature for adding or removing items after an order is placed.
In a matter of weeks he became the go to person for his knowledge and understanding of the often complex customer experience issues. He has garnered trust with every team member at every level by giving solid, well structured and meaningful insights that kept our priorities and projects on the right course.
Candice Diemer, Head of UX, WooliesX